Syllabus :GS 3/Economy
Context
- According to the World Bank’s Poverty and Equity Briefs (PEBs), India’s extreme poverty dropped significantly from 16% in 2011–12 to 2.3% in 2022–23, marking major progress in poverty reduction.
About the Poverty and Equity Briefs (PEBs)
- They are biannual reports by the World Bank and provide a quick overview of poverty, inequality, and shared prosperity trends in over 100 developing countries.
- It is released during the Spring and Annual Meetings of the World Bank and IMF, they aim to keep poverty reduction central on the global agenda.
Measurement
- Poverty rates and total number of poor as measured by the national poverty line and for the international extreme poverty line ($2.15 in 2017 PPP terms), as well as the lower-middle-income ($3.65) and upper-middle-income ($6.85) poverty lines.
- Comparable poverty and inequality trends for apples-to-apples comparisons over time and across countries.
- Multidimensional poverty measure, including measures of poverty that also reflect non-monetary deprivations that poor people face in areas like education and access to basic services.
- Inequality as measured by the Gini Index.
Recent Findings for India
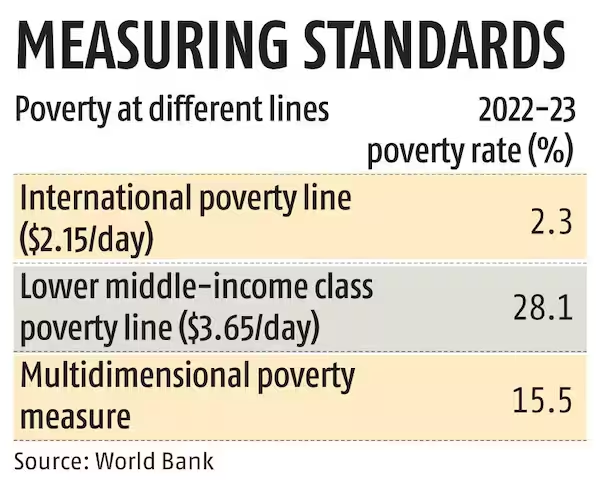
- India has made significant progress in reducing poverty, with extreme poverty — measured at $2.15 per day in purchasing power parity (PPP) terms — falling from 16 per cent in 2011–12 to 2.3 per cent in 2022–23
- The decline lifted 171 million people above the internationally comparable poverty line.
- Rural extreme poverty declined from 18.4% to 2.8%, and urban from 10.7% to 1.1%, narrowing the rural-urban gap significantly.
- Using the $3.65/day lower-middle-income countries (LMIC) poverty line, poverty dropped from 61.8% to 28.1%, with 378 million people moving above the threshold.
- The World Bank’s multidimensional poverty index (MPI), which includes extreme poverty but excludes nutrition and health deprivation, showed that non-monetary poverty declined from 53.8 per cent in 2005–06 to 16.4 per cent in 2019–21, and further to 15.5 per cent in 2022–23.
- India’s five most populous states — Uttar Pradesh, Maharashtra, Bihar, West Bengal, and Madhya Pradesh — accounted for 54 per cent of the country’s extreme poor in 2022–23 and 51 per cent of its multidimensionally poor in 2019–21.
- These states had contributed 65 per cent of the extreme poor in 2011–12 and drove two-thirds of the overall decline by 2022–23.
- Despite improvements, wage inequality is high, the top 10% earn 13 times more than the bottom 10%.
- The Gini index based on consumption improved (28.8 to 25.5), but income inequality rose (Gini from 52 to 62).
- Youth unemployment stands at 13.3%, rising to 29% among graduates, with most jobs remaining informal, particularly in agriculture.
- Female employment remains low at 31% with a 234 million gap compared to men, though overall employment has been growing since 2021–22.
| Do you know ? – Gini index is a measure of income inequality within a population, ranging from 0 to 1, where 0 represents perfect equality and 1 represents perfect inequality. |
Source :BS
Previous article
Over 160 Killed by Lightning in March-April 2025